Overview
MAGYC is a web service dedicated to multiwavelength validation and/or analysis of galaxy clusters.
This web service can be used in two different ways available in the Query form
-
Single position mode
Enter a target position in your prefered coordinate system, optionally a redshift and choose the analyses (described below) you want to perform. The right part of the page shows you a summary of your choices. Press Submit and wait a few secondes or minutes, depending of the choice of analyses, and you can visualize a summary of the results and/or download an archive of the results in the Job manager page. You can copy/keep the Request ID to come back to the results during 3 days.
-
Muliple target mode
By uploading a file containing a list of target positions following the proposed template, the webservice will perform the full analysis (all jobs described below are executed) of all targets. You will receive an email with the Request ID at launch and an email telling when the jobs are finished. Using the Request ID you can retrieve the archive of the analyses by entering the Request ID on Job manager page.
Use the Contact page to send us any comment.
Code description
Catalog cross match
A cross match within a radius of 10 arcmin is performed with a list of galaxy cluster catalogs by OV conesearch. The current list is composed of:
-
SDSS cluster catalog from Wen et al. 2012 ['J/ApJS/199/34' in CDS-Vizier]
-
SDSS cluster catalog from Rykoff et al. 2016 (Redmapper DR8) ['J/ApJS/224/1/cat_dr8' in CDS-Vizier]
-
SZ clusters from the meta catalog SZMC (szcluster-db.ias.u-psud.fr)
-
X-ray clusters from the meta catalog MCXC (Piffaretti et al.) ['J/A+A/534/A109' in CDS-Vizier]
The closest cluster from the given postition is given with typical properties, including the name and original index in the above catalogs. If no match is found, the table will show "-". If the cross-match has failed (database not available) the table will show "-1".
Observatory search
A cone search is performed in the following observatories databases with a 1arcmin radius:
-
XMM [ https://nxsa.esac.esa.int/]
-
Chandra [ https://cxcfps.cfa.harvard.edu]
-
HST [ MAST by astroquery]
If a observation is found, typical properties are shown (observation time, total observational time if more then one obsveration, name of the observation, wavelenght). If no match is found, the table will show "-". If the query has failed (database not available) the table will show "-1".
SZ analysis
Cutout in the Planck ymap (2015, 7arcmin resolution 1) is performed and returned. The cutouts are 128x128 pixel of 1 arcminˆ2. If the target position falls in the SPT footprint, the cutout is performed on the Planck+SPT y-map 2. In the archive, a y-profile computed from the center is also returned (figure and data) as well as an estimated flux (aperture photometry).
Xray analysis
Cutouts in the ROSAT [1.5-2.2keV band] emission map is performed and returned. The cutouts are 128x128 pixel of 0.5 arcminˆ2. In the archive, a y-profile computed from the center is also returned (figure and data) as well as an estimated flux (aperture photometry).
Optical analysis
Overview
Works in two different modes.
If the target’s redshift is unknowm, the optical analysis aims at proposing one or several optically selected clusters in a radius around the target position (30 arcmin is the current default value). This is achieved by running a cluster finder and a suite of analysis tools to provide a galaxy based characterisation of all detections. Delivered products include a redshift estimate for each component, in a redshift range conditioned by the depth and wavelengths coverage of the available local galaxy surveys.
If the target’s redshift is known, the optical analysis focuses on the detection and characterization of neighbouring structures in a radius of 10 Mpc around the target.
Input data
The optical analysis is based on publically available large photometric and spectroscopic surveys. The photometric information currently includes the Sloan Digital Sky Survey (REF) and the CFHT Legacy Survey (REF). When several surveys are available, and if the redshift of the target is unknown, the analysis is performed on the deepest available surveys. However, if the redshift is known and z < 0.3, the SDSS is selected.
Analysis codes
Cluster detection and probability membership assignment are based on the WaZP algorithm presented in Aguena, Benoist et al. (2020) and in Castignani & Benoist (2016).
Quantities computed for detected cluster
Contained in the returned cluster fits table.
-
Photometric redshift
-
center (ra, dec)
-
\(R_200\)
-
N200
-
Spectroscopic redshift
-
Velocity dispersion
List of returned products
The optical analysis returns first information on the input galaxy data:
-
[red] survey_plot.png [black] Plot showing the position of the target relative to the available surveys on the whole projected sky.
-
[red] galcat.fits [black] Local galaxy catalog (RA, Dec, mags, mag_errs, zp) crossmatched with available spectroscopic information.
-
[red] g(r,i).fits [black] g, r, i-band images of the central 5 arcmin around target position.
-
[red] gri.png [black] (gri) color image of the central 5 arcmin around target position with all photometric and spectroscopic sources overlayed.
-
[red] gri.png [black] (gri) color image of the central 5 arcmin around target position without any overlay.
-
[red] radec.png [black] (RA, Dec) scatter plot of galaxies in the whole field of analysis.
-
[red] zpzs.png [black] (zp, zs) scatter plot of galaxies in the whole field of analysis.
The optical analysis returns first information on detected clusters:
-
[red] clusters_in_search_radius.fits [black] A list of all detected clusters (Fits file). In the case of a target without redshift this is the list of the 3 richest detected clusters within the search radius. In the case of a target with known redshift, this is the list of all clusters with richness N200>20 within a radius of 10 Mpc and with a redshift z / abs(z-z_target) < 0.05.
-
[red] members.fits [black] A list of cluster members for each detected cluster (Fits file). Each galaxy of this file has its galaxy ID refering to the input galaxy catalog, a cluster ID, and a membership probability (pmem).
-
[red] gri.png [black] (gri) color image of the central 5 arcmin around each detected cluster (PNG).
-
[red] wmap.png [black] A galaxy density map based on wavelet decomposition at the redshift of each detected cluster.
-
[red] wmap.fits [black] A galaxy density map based on wavelet decomposition at the redshift of each detected cluster.
-
[red] radec.png [black] (RA, DEC) scatter plot of galaxies in the whole field of analysis with all detected clusters overlayed.
-
The distribution of spectroscopic redshifts in a radius of RR centered around each detected cluster (PNG).
-
The distribution of velocities for each detected cluster when enough spectroscopic redshifts (PNG).
Technical description
General architecture
MAGYC is a Java web application that uses the Spring Boot framework. The MAGYC architecture is based on two kinds of components:
-
A frontal server
-
Two node servers, hosted at Observatoire de la Côte d’Azur (OCA) and Institut d’Astrophysique Spatiale (IAS)
Only the frontal server is publically accessible by the users of the service.
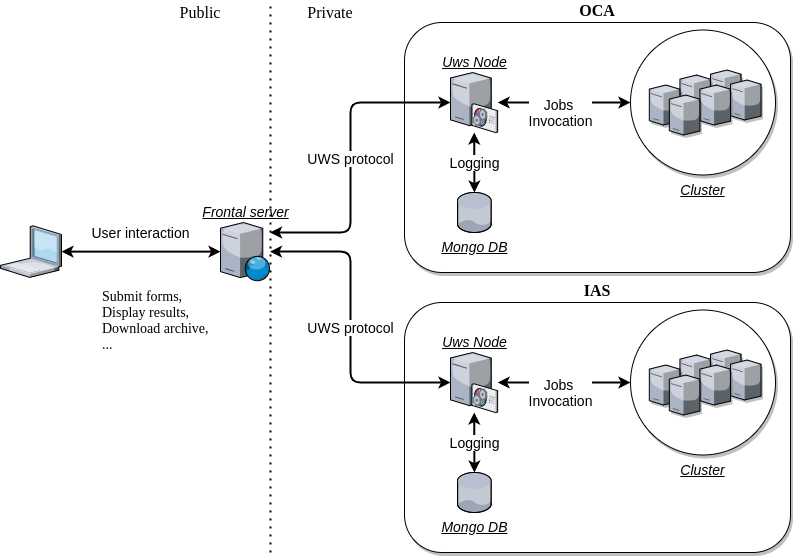
The frontal server is is charge of all interactions with users. It communicates requests to both node servers using the UWS protocol through the powerful UWS library from CDS. The nodes are in charge of jobs management. These jobs run on laboratory clusters.
Processing of a MAGYC request
When you submit a MAGYC request, several jobs need to be launched. The frontal server transmits the list of jobs with their associated parameters to the nodes. Then, the nodes launch the types of jobs that they support. When you are on the status page for a request, the nodes are reguarly queried for job statuses, which are reported back to you. When the jobs are all finished and you request the results, the data are downloaded from the nodes to the frontal server and packed into a single zip archive that you can download.
Multitarget MAGYC requests are treated in the same way as single target requests: they usually just consist of more jobs to launch with different paremeters.
Nodes capabilities
The types of jobs supported by the nodes are the following:
-
OCA node: Optical analyses.
-
IAS node: Catalogs, Observatory logs, SZ and X-ray analyses.
This is useful to know, especially when one node is down (which can be checked on the Status page).